Diversified Investment EMA Cross Strategy SimulatorThis simulating indicator proves that even if you use a simple strategy, you can reduce your risk by diversifying your investments.
The strategy itself is simple.(only long)
Buy when 50 days EMA crosses over 200 days EMA.
Sell when 50 days EMA crosses under 200 days EMA.
Or, stop loss when the asset falls by 2% (eg).
Using this simple strategy on an asset is just a test of your luck.
However, this capital change graph shows that risk can be reduced by diversifying investment into eight assets rather than one asset.
Options
Total Assets Capital Change represents the sum of capital changes for 8 assets. The gray line is the initial capital.
Each Asset Capital Change represents all eight asset capital changes. In this case, the gray line is displayed as the initial capital divided by 8.
The rest of the options show a graph of capital change for each asset, showing when buys and sells occurred.
And set the start date, initial capital, stop loss %, and commission.
And select the 8 assets you want to invest in and you are ready to go. To effectively reduce risk, uncoupled assets would be better if possible.
The table in the lower right shows the selected asset and color.
Please enjoy the simulation.
Cerca negli script per "the strat"

Cipher Twister - Long and ShortINTRO / NOTES:
This script is based on Market Cipher B Oscillator by Falcon
The difference in this script is that only the useful points are printed on the indicator, namely Long and Short Trade Execution signals to be used by a bot, namely the PT Bot.
The script also differs from the original that it has been upgraded to Pinescript v4
This oscillator can be used with ALL time frames, but generally works the best on 15 minute and 1 hour charts on ANY market, no matter, stock, forex, crypto, spot, futures, derivatives, Nasdaq etc...
DEFINITIONS:
This oscillator forms the foundation of Buy and Exit of Long and Short Trades.
There are 2 'Red' Lines at the top of the channel and 2 Green Lines at the bottom of the channel.
These two channels are set at default to be +53 / -53 and +60 / -60 respectively. These two lines will serve as the threshold point if one is to make cautious trades only.
There is a center line which divides the Oscillator into two parts. Above the center line, the market is in over bought territory and Below the center line is in over sold territory.
'Red' dots are drawn by the indicator to represent a potential Short (or a signal to exit from a Long position)
'Green' dots are drawn by the indicator to represent a potential Long (or a signal to exit from a Short position)
The 'Red' and 'Green' dots are draw when a Cross between both wt1 & wt2 cross, thus providing a fantastic indication of potential trend reversal and entry/exit of a position.
STRATEGY NOTES:
The strategy to use this indicator with for realistic and proper results would be to use it with an automated Trading Bot such as Profit Trailer (PT-BOT)
You could use this strategy manually, however it would mean you would need to sit in front of the screen all day and night long and activate the trades immediately after the 'red'/'green' dots are drawn. Usually this will result in non-optimal entries and exits as well as loss on various instances when a 'red' and 'green' dot are printed close together (which is usually when the market goes into correction/consolidation) and slow entries/exits will result in a loss rather than a small profit or exit at BE (Break Even)
ACTUAL STRATEGY (For use with automated bot)
To be used in conjunction with Heikin Ashi Candles for added cautionary measures
For LONGs ONLY
--------------------
1/ When 'Green' dot is drawn, ACTIVATE Long Position
(Use 1.5% Risk Management for each trade)
(Use Lot size based on 1.5% risk management and xLeverage (if any))
2/ Make sure bot Opens an SL (Stop Loss) value based on 1.5% Risk Management
3/ When 'Red' dot is drawn, CLOSE Long Position.
*If you want to add extra caution to your trade, only activate the trade if the 'Green' dot is BELOW the 'Green' Markers
*For added caution, use color coded Heikin Ashi candles to 'confirm' Activation and Closing of a trade in the bot configuration
---------------------------------------------------------------------------------------------------
For SHORTs ONLY
--------------------
1/ When 'Red' dot is drawn, ACTIVATE Short Position
(Use 1.5% Risk Management for each trade)
(Use Lot size based on 1.5% risk management and xLeverage (if any))
2/ Make sure bot Opens an SL (Stop Loss) value based on 1.5% Risk Management
3/ When 'Green' dot is drawn, CLOSE Short Position
*If you want to add extra caution to your trade, only activate the trade if the 'Red' dot is Above the Red Markers
*For added caution, use color coded Heikin Ashi candles to 'confirm' Activation and Closing of a trade in the bot configuration
---------------------------------------------------------------------------------------------------
Supplementary Notes:
Make sure that your bot configuration will only activate ONE TRADE when the 'Green'/'Red' dot appears.
Occasionally during high volatility , 'red'/'green' dots will appear intermittently before remaining drawn, thus the oscillator 'redraws' the dots during market movement.
There will be times where occasionally a 'green' dot or a 'red' dot will appear, the trade will be opened, but the trade will fail due to the market manipulation (algorithm/market maker bots/fake volume etc), to wipe out those trading on derivatives and futures markets using leverage. Do not worry about this, no bot can make 100% wins, no strategy will achieve 100% win ratio and one necessarily doesn't need a high win ratio when using strict money management practices with your trading for SL and lot size.
If you use this method, you will see great results, but again I must stress, using this method with a fully automated bot is the only way to achieve proper results.

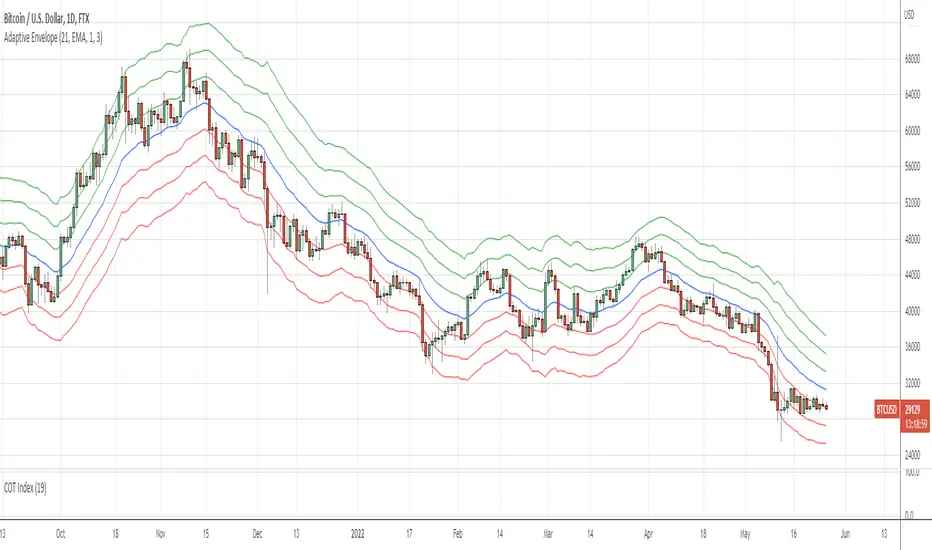
Adaptive EnvelopeI bring to your attention a dynamic indicator Adaptive Envelope .
The main qualitative characteristic of the technical indicator is adaptability. This means that it does not need to be adjusted for each tool. The adaptive envelope itself dynamically adjusts to the volatility of each individual instrument, or even timeframe.
And thanks to a wide range of settings, the indicator can be adjusted to your needs. Let's consider an example of the use of the indicator in trading.
Option #1. The envelope shows the "stretch" of the market - that is, the price of the asset beyond normal volatility. And it is at such moments that the probability of returning to the average is highest. That is, for such a signal, we wait for the exit to the moving average, and when returning with a stop order, we enter the averaging direction.
Option #2. Another option for trading is to buy at the lower level, as well as additional purchases along the lines of the envelope. Exit - on the middle line of the envelope (for shorts on the contrary) - so we have a full adaptability of the strategy. I repeat that due to adaptability, there will be no need to reconfigure when changing market characteristics.
Thank you for attention. Sincerely, Oleksandr Yanchak. Capitalizator.UA
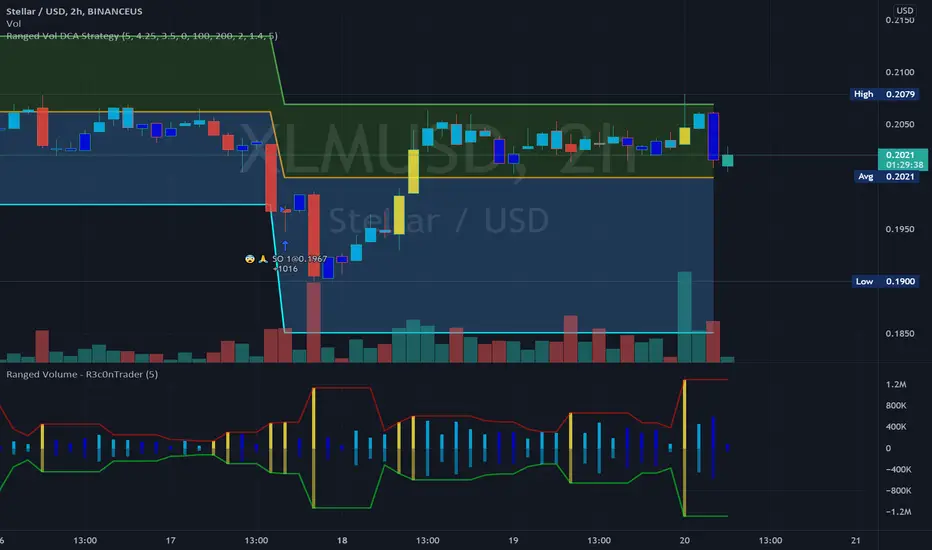
Ranged Volume Study - R3c0nTraderCredits:
Thank you "EvoCrypto" for granting me permission to use "Ranged Volume" to create this version of it.
What is this and What does this do?
This study shows the ranged volume, and it can be used to produce buy signals for a 3Commas bot.
What’s different about this script?
I added code so that negative volume has its own color settings and lower opacity than the positive volume.
I changed the color scheme from Yellow, Red, Green, and Black to Yellow, Red, Light Blue, and Dark Blue.
How to Use
1. On the “Inputs” tab:
a. Set your “Volume Range Length” (number of bars to look back)
b. “Heikin Ashi” – Usually I leave this enabled. Make sure this matches what you have in your strategy!
c. “Show Bar Colors” – Leave disabled. Let the Strategy script color the bars in the price chart.
d. “Show Break-Out” – Leave enabled. Highlights the volume breakout in yellow and breakdowns in red.
e. “Show Range” – Leave enabled
Inflation Rate of ChangeInflation and the Fed interest rate impacts all corners of the economy. Today I am releasing to the community an indicator that measures the rate of change of inflation with historical data back to ~1950. I built this to study the historical market impacts of inflation and changes to the Fed rate (see separate indicator I published for Fed Funds Rate here ).
What this indicator does:
This indicator pulls in Consumer Price Index data and applies a rate of change formula to it. The output is measured as a percentage. I.e. 7 would mean a 7% rate of change over the look-back period.
Options in the indicator:
You can change the amount of bars back it uses to calculate rate of change. By default it is set to 253, which would be looking 1 year back on a normal stock market day chart. If you are on a month chart, you would input 12 there to look 1 year back, etc.
There are also different versions of the CPI that you can select with a drop-down input to pull in different inflation measures:
FRED:CPIAUCSL = Urban Consumers, All Items (this is the default data it pulls, and is a common way to measure inflation)
FRED:CPIUFDNS = Food
FRED:CPIHOSNS = Housing
FRED:CPIENGSL = Energy
Disclaimer: Open-source scripts I publish in the community are largely meant to spark ideas that can be used as building blocks for part of a more robust trade management strategy. If you would like to implement a version of any script, I would recommend making significant additions/modifications to the strategy & risk management functions. If you don’t know how to program in Pine, then hire a Pine-coder. We can help!
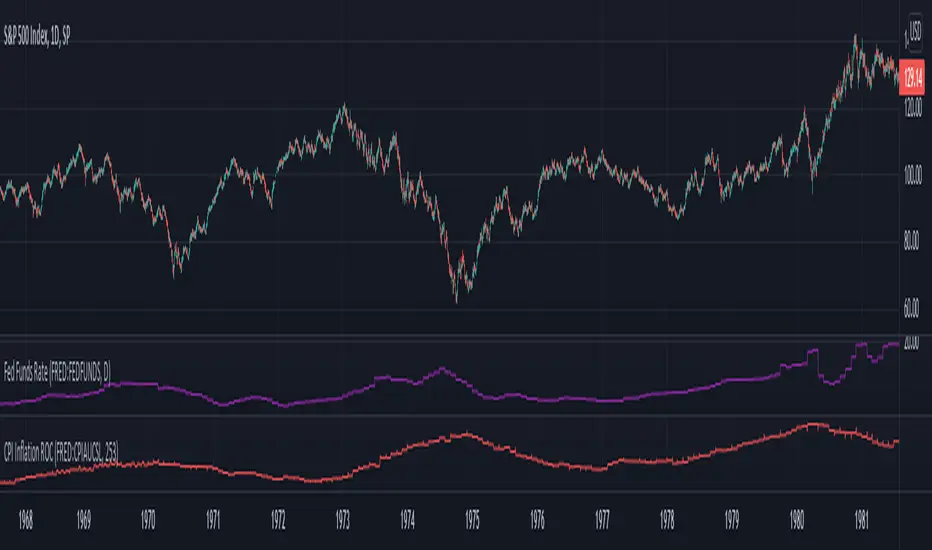
Fed Funds Rate IndicatorWith the current level of inflation and the Fed outlook on interest rates, it inspired some studying on the relationship between Fed rate increases and stock market performance over periods of inflation. Today I am releasing to the community an indicator that will show you the Fed Funds Rate historically. You can add it to any chart or index to study the impact of Fed Funds Rate changes.
There are 2 options for the indicator data source you can select in the indicator settings. FRED:EFFR data updates daily but only goes back ~20 years. FRED:FEDFUNDS data only updates monthly but goes back to 1947.
Disclaimer: Open-source scripts I publish in the community are largely meant to spark ideas that can be used as building blocks for part of a more robust trade management strategy. If you would like to implement a version of any script, I would recommend making significant additions/modifications to the strategy & risk management functions. If you don’t know how to program in Pine, then hire a Pine-coder. We can help!

Backtesting- IndicatorFor anyone interested, Here is an example of how to put backtesting results into an Indicator. This calculates the same values as you find in the Summary Screen of the built in Strategy backtester. This will use the same result size as the standard backtester i.e. 5 minute chart grabs roughly 1 month of data, 1 minute chart grabs 1 week of data, etc... I tried to keep this as self-contained as possible so I put most of the code for the results in the bottom of the Indicator. The results stop at the last completed trade signal i.e. a Buy has a Sell to it. This is the same indicator I posted earlier with the PCT Trailing StopLoss so you will see that code in here as well. As said in my previous posting, the indicator is just a simple EMA crossover to give it something to do and I would not recommend using this indicator on its own, but instead copy the code to your own indicator if you find it useful. I also left the code in so that you can switch back to a Strategy if you want to verify the results.
Additional Notes:
- The results are within an acceptable margin of error due to the fact that the Indicator is having to calculate based on when the Buy and Sell Signal occur as opposed to when actual trades occur like in the Strategy Backtester
- I was trying to find a way to set the number of Buy Signals to use i.e. show me the results from the past 100 trades but couldn't sort out the logic. I am open to suggestions. Also keep in mind I am not a coder by profession so if you have any ideas on that front, please explain it to me as though I am a 5 year old child and provide code examples if possible :)
- I included the Strategy results in the Screen Shots so that you can see where the results line up.
Additional Additional Note:
This is not financial advice. Use at your own risk.

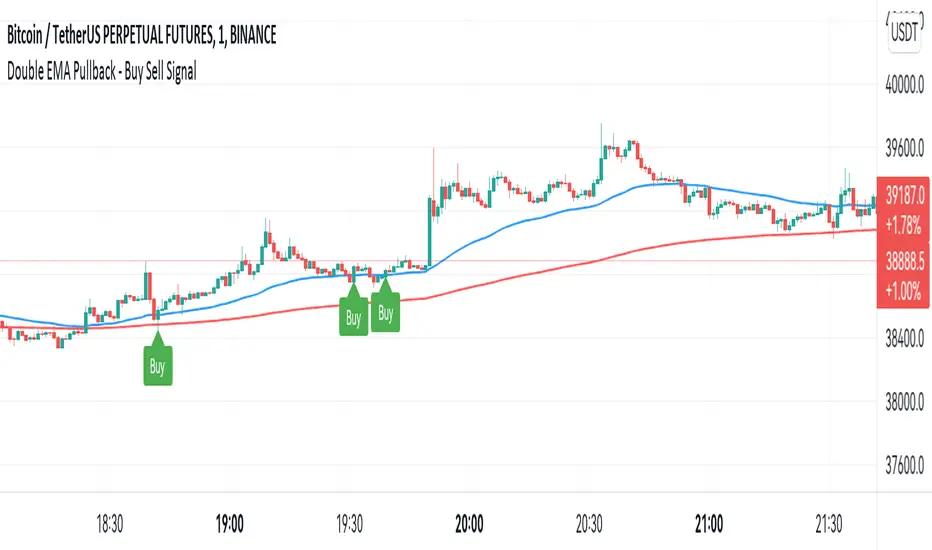
Double EMA WIth Pullback Buy Sell Signal - Smarter AlgoBuilt with love "Double EMA With Pullback Buy Sell Signal "
This indiator will help you to find a Double EMA Pullback Signal
You can combine with your own strategy, or use this purely
DISCLAIMER :
Measure the risk first before use it in real market
Backtest The Strategy was very important, so you know the probability
Fundamentally Logical :
Pullback (Some Previous candle is Red for Bull Pullback vice versa)
the Entry candle must be a Candlestick Pattern
Features :
1. Double EMA
2. Pullback Signal
How to use it :
1. Adjust the Pullback Backstep
2. Adjust the EMA Period
3. Adjust the Style to your preferences
Regards,
Hanabil
Smarter Pullback + Candlestick Pattern (Steven Hart)Built with love "Smarter Pullback + Candlestick Pattern"
This indiator will help you to find a Pullback + Candlestick Pattern, inspirated by Steven Hart
You can combine with your own strategy, or use this purely
DISCLAIMER :
Measure the risk first before use it in real market
Backtest The Strategy was very important, so you know the probability
Fundamentally Logical :
Pullback (Some Previous candle is Red for Bull Pullback vice versa)
the Entry candle must be a Candlestick Pattern
Features :
1. Engulfing
2. Hammer & Shooting Star
3. Doji
How to use it :
1. Adjust the Pullback Period
2. Check and Uncheck the Pattern you want to see
3. Adjust the style to your favourite
Regards,
Hanabil

Smarter SNR (Support and Ressistance, Trendline, MTF OSC)Built with love "Smarter SNR (Support and Ressistance, Trendline, MTF OSC) "
This indiator will show you Support & Ressistance, Good Trendline, and Multi-timeframe analyzing of Oscillator (Stochastic and RSI)
You can combine with your own strategy, or use this purely
DISCLAIMER :
Measure the risk first before use it in real market
Backtest The Strategy was very important, so you know the probability
Fundamentally Logical :
SNR -> Last 3 Zigzag Pivot
Trendline -> Using two last pivot for calculating the slope
Features :
1. SNR
2. Trendline
3. MTF Oscillator Analyzing
How to use it :
1. All Label, Table & Line can be turned on/off in settings
2. Pivot Period can be Adjusted in settings
3. All Label, Table & Line style can be adjusted in settings
Regards,
Hanabil

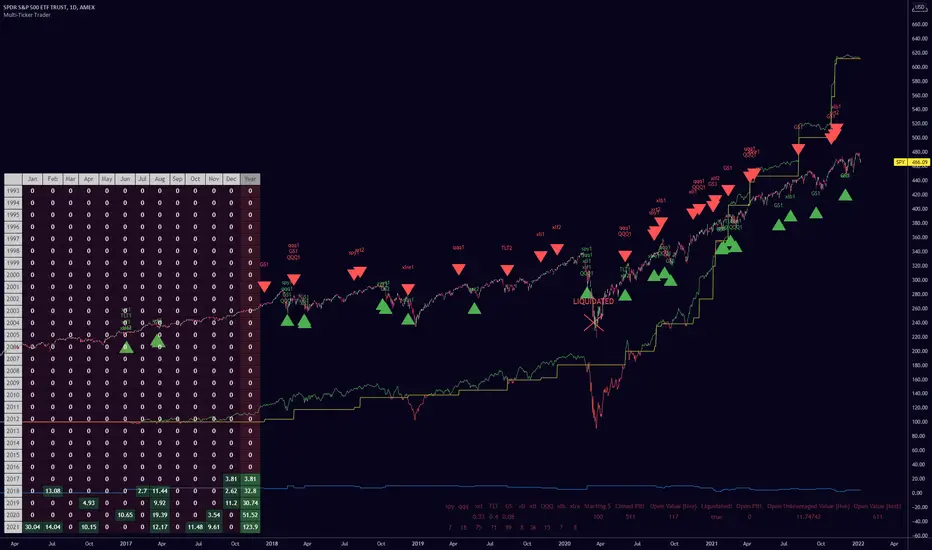
Multiple Ticker TraderThis indicator can be used as an alternative to the built in Strategy Tester for those who want to (back) test a strategy on multiple tickers simultaneously and see it's performance.
Just change the buy and sell conditions in the code to fit your needs.
The strategy I've used here is scaling into up to 10 tickers a maximum of 5 times per ticker every time they retrace (another) 10% from their all time high.
You can set the maximum number of total trades and disable scale ins by setting them to an impossible number (such as, 99% away from the all time high).
Credit to QuantNomad for the monthly/yearly returns table bottom left.
The bottom right table shows the current number of shares the algo is long and also the total all-time returns from each individual ticker, and other data.
The blue line is the number of positions the script is currently long. Each scale into the same ticker represents one position.
The yellow line is the closed P&L.
The green/red line is the live P&L.
I've used leverage for the example image just to showcase the liquidation display.
These particular buy/sell conditions cannot close positions at a loss, so be careful if you're wild enough to use this setup live without understanding the script yourself. I haven't used it live myself yet and you should assume there are serious bugs before thinking about using it live, though I'm using a similar thing on cryptos and it's going fine.
You can edit the leverage, maximum trades and back test range in the settings. The number following the ticker on each label represents which scale in was bought/sold.
Enjoy :) let me know if you find any good results
Smart RebalanceThis script is based on the portfolio rebalancing strategy. It's designed to work with cryptocurrencies, but it can work with any market.
How portfolio rebalance works?
Let's assume your initial capital is $1000, and you want to distribute it into 4 coins. This script takes the USDT as the stable coin for the initial money, so in case you want other currency, the pairs must be with that fiat as the quote.
Following our example, you would take BTC, ETH, BNB, and FTT. After selecting the coins, it's time to choose how much allocation is on each. Let's put 25% on each. This way, $250 of our capital on each coin.
After selecting the coins and their allocation, you choose the price change ratio for rebalancing. Let's use 1%. Next, you start to watch the markets. The first thing that happens, following our example, is the BTCUSDT price moving 1% up.
That amount hit the ratio of 1% for the rebalance. Hence, you sell 1% of BTC for USDT and redistribute to the other coins, buying 0.25% of each currency to rebalance the portfolio.
Next, ETHUSDT goes 1% down, time to rebalance again. This time, you need to take 0.33% of each other coin and buy ETH, so this way, it's all divided as the chosen allocation.
Why use rebalancing?
Looks easy, right? It is, but very time demanding. Demands even more if you raise the number of coins you want to distribute. Having a system to do that automatically is a must to work efficiently. Rebalancing spreads the risk among multiple currencies. This way, you earn small when it goes up, but you lose small when it goes down.
What this script helps with portfolio rebalance?
This indicator will not buy/sell for you but will help you choose the best markets for your rebalancing. Which coin will work best in that period? Do I need to have more than 8 coins? How much must be my ratio? Those questions you can answer using this indicator.
What this script has?
Start and End dates
The script will work for a certain period. All calculations will be done in that period.
Coin Ratio %
The amount of price movement of each asset that will be used to calculate the rebalancing
Initial Capital and Broker Fee
The amount of capital to be used on the rebalancing and the broker fee you want to use the strategy. The cost will be applied on every trade, buying or selling the coins.
Assets, allocations, and colors
It's possible to select from 2 to 10 assets to be used on the portfolio. Each purchase must have the allocation %. Suppose the sum of the allocations is different from 100%. In that case, a warning message will appear on the chart instead of the statistics.
Panel and tooltips
There is a panel with a summary of the results
Set allocations automatically
There is an option to make the indicator use the daily asset volume from the day before to determine the allocation percentage of each asset. This option is better if you are unsure how much allocation you want to use on each coin.
Use this indicator as a backtest for your rebalancing strategy. The selected market on the chart will not affect the calculation on this indicator, but the time frame will. The higher the time frame, the higher the coin ratio % must be.
About the code
The code is written to use arrays to store the values of each asset, making the calculations on each candle inside the time range. The for-loops are used to reduce the code length and make it easy to change the analysis of all assets. Finally, the script has some comments on the code.

BTCUSDTPERP MEGABOT 60min [ALERTS VERSION]BINANCE:BTCUSDTPERP
Hello, this is my alerts version of BTCUSDTPERP MEGABOT 60min
THIS BOT IS ONLY FOR BTCUSDTPERP ON BINANCEFUTURES !!!!!!!!!!!!!!!!!!!!!!!!!!!!!!!!!!!!!!!!!
This configs are only for this pair on this market,
It depends of volume , and others indicator
Bot is making amazing results at configs
TP - 4.5%
SL - 7%
Strategy using 4 indicators :
ADX
RSI
VOLUME
MACD
ADX - makes a solid view to trend without any scam wick :
Long only on green bars
Shorts only on red bars
That's helps my strategy to define a right trend
there is also a orange option for unidentified trends
RSI - value helps strategy to stop trade in right time
When RSI is overbought strategy don't open new longs
also when RSI is oversold strategy don't open new shorts
Volume - volume is the most important indicator for the strategy,
to avoid open trades on flat chart, new trades are open after a strong volume
wicks
MACD - this indicator is for define the trend
So the way this bot is working is simple
when every arguments are confirmed , then strategy open trades
Enjoy !!!

PYRAMIDING BTCUSDTPERP1H [ALERTS VERSION]BINANCE:BTCUSDTPERP
Hello
This my upgraded (ALERTs) version of my previous bots, uses diffrent indicators
WARING
THIS STRATEGY WORKS ONLY ON BTCUSDTPERP ON BINANCE 60MIN (like my previous ones) !!!!!!!!!!!!!!!!!!!!!!!!!!!!!!!!!!!!!!!!!!!!!!!!!!!!!!!!!!!!!!!!!!!!!!!!!!!!!!!!!!!!!!!!!!!!!!!!!!!!!!!!!
- it depends on specyfic volume and wick based on binance
Soo, I was tried to make a bot with more trades to make more real results.
Trends are change, and the problem with configuration on bots is that, while we searching the best cofigurations , this was best configuration in the past,
to prepare bot for the futures moves , we have to make as much trades as possible.
This bot is pure definition of pyramiding, uses 2 entries, and when all the conditions are true, then will open a trades
The way it works is simple, bot use 6 difrent indicators to open longs/shorts and for the define trend
This specific configuration works the best at
TP: 1.4%
SL: 9%
This is bot only for lev 1x
Dont try it for bigger leverage, becouse when sl hits, which sometimes happend, the lost will be huge
Why sl is so big?
Bot is programed to replace sl with other entries
for example
close longs and open shorts
normal lose is around 3-5% (while trend is changed), so sl will only destroys results
this bot using 6 difrent indicators:
ADX
RSI
VOLUME
RANGE FILTER
MA 5-10-30
MACD by KivancOzbilgic
ADX - makes a solid view to trend without any scam wick :
Long only on green bars
Shorts only on red bars
That's helps my strategy to define a right trend
there is also a orange option for unidentified trends
RSI - value helps strategy to stop trade in right time
When RSI is overbought strategy don't open new longs
also when RSI is oversold strategy don't open new shorts
Volume - volume is the most important indicator for the strategy,
to avoid open trades on flat chart, new trades are open after a strong volume
wicks
RANGE FILTER- this indicator is for the better view of trends, define trends
MA 5-10-30 - like previous ones this is for better view of trends, and correctly define the trends
MACD by KivancOzbilgic - this indicator is based of MACD RELOADED by Kivanc Ozbilgic
Also like previous ones, indicator should help defined correct trends
Enjoy ;)
WaveTrend 4h/24mWaveTrend 4h/24m is a trading tool based on two WaveTrend timeframes.
For this script the WaveTrend calculations made by LazyBear were used. WaveTrend is a widely used indicator for finding direction of an asset.
The strategy is developed by Youtuber Jayson Casper. The main strategy on the 4 hour and 24 minute timeframes, this will be the default timeframes. Timeframes can be adjusted in the indicator interface.
With Jaysons' we wait for both timeframes to have last printed a green dot for longs, and both timeframes to have last printed a red dot for shorts. When this occurs a green diamond will be printed for longs, a red diamond for shorts.
Make sure to always use the chart from the smallest timeframe you're using, so by defaults use the 24 minute chart.
Features of the indicator:
- WaveTrend Timeframe 1 (Blue/Lightblue wave).
- WaveTrend Timeframe 2 (Blue/Purple line with filled background between the lines).
- VWAP (Yellow wave which is turned off by default)
- Green/Red Diamonds
What to look for?
This script is all about the Green and Red Diamonds.
A Green diamond will be printed when on both the 4 hour and 24 minute timeframe the last printed dot was a green dot.
A Red diamond will be printed when on both the 4 hour and 24 minute timeframe the last printed dot was a red dot.
What are the Green and Red Diamonds based on?
When both VWAP timeframes are ABOVE 0, a green diamond will be printed. This is equivalent to the last dot on both WaveTrend timeframes being a green dot.
When both VWAP timeframes are BELOW 0, a red diamond will be printed. This is equivalent to the last dot on both WaveTrend timeframes being a red dot.
Happy Trading!

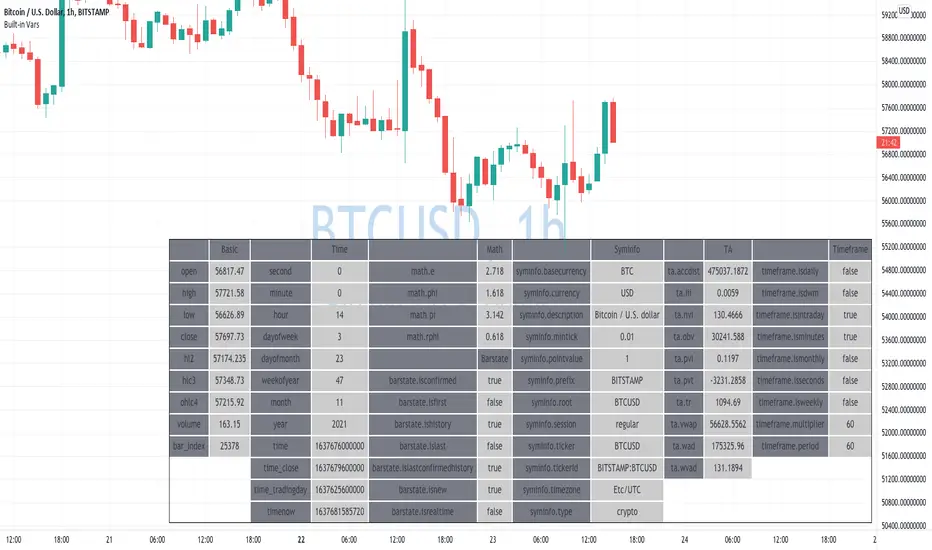
Learning Built-in VarsI'm currently working on v5 of my Pine Script Programming Course.
As a part of it, I'm building a few tools/widgets to help students get the content easier.
Here is one of the tools. It's quite basic with it you can select a bar and see all the build-in variables for this bar (Except strategy variables)
I hope it will help you in learning Pine Script!
Disclaimer
Please remember that past performance may not be indicative of future results.
Due to various factors, including changing market conditions, the strategy may no longer perform as well as in historical backtesting.
This post and the script don’t provide any financial advice.
Scalping IchimokuBased on the Ichimoku Cloud indicator, the Scalping Ichimoku is a strategy applied in a simple form.
How the strategy works?
The indicator will watch two filters from the Ichimoku Cloud indicator. The first one is when the price crosses the cloud (over or under). The second filter is when the conversion line crosses the baseline (over or under). When both filters happen, no matter the order or when the indicator will print an arrow signal.
Buy Signal
A buy signal, or arrow up, will appear when the price crosses over the cloud and when the conversion line crosses over the baseline.
Sell Signal
A sell signal, or arrow down, will appear when the price crosses under the cloud and the conversion line crosses under the baseline.
Exit Points
Show Exit Spots enabled. The indicator will print possible exit spots for the last entry, based on the cross from conversion with baseline. In case the cross is against the latest entry signal, it will show an "X"
One Signal At Time
The indicator will print only one signal in a single direction. It will never print the same signal as the last signal
Exit and Entry Spot At The Same Candle
In the chart, when the entry spot and an exit spot appear in the same candle, the exit spot will appear with a different color. This means that the entry spot is more accurate.
This strategy was designed for scalping, no matter the time frame or market, but it may work for swing traders as well.

RM Timeframe ContinuityThis indicator plots a table off to the right of the chart to help with determining timeframe continuity. Per the Strat, a great edge is only taking trades where full timeframe continuity is in place (i.e. if you are going long, make sure other timeframes are also green).
In this script:
Green candles have green colored boxes, red candles have red colored boxes.
Inside bars are represented by a circle - ⬤
Outside bars are represented by a tall rectangle - ▮
2-up bars are indicated by an up arrow - ▲
2-down bars are indicated by a down arrow - ▼
User defined options:
Pick any timeframe for the 4 boxes
Choose whether to plot the highs/lows of the larger timeframe candles as horizontal rays on your chart (along with the associated colors)

RSI Rising Crypto Trending AlertAlert version of the strategy with the same name
This is crypto and stock market trending strategy designed for long timeframes such as 4h+
From my tests it looks like it works better to trade crypto against crypto than trading against fiat.
Indicators used:
RSI for rising/falling of the trend
BB sidemarket
ROC sidemarket
Rules for entry
For long: RSI values are rising, and bb and roc tells us we are not in a sidemarket
For long: RSI values are falling, and bb and roc tells us we are not in a sidemarket
Rules for exit
We exit when we receive an opposite direction.
Cuation: Because this strategy uses no risk management, I recommend you takje care with it.
If you have any questions, let me know !

ICHIMOKU Crypto Swing AlertThis is a crypto swing alert for the strategy with the same name designed for timeframes bigger than 1h.
The main components are
ICHOMOKU
KDJ
Average High
Average Low
Rules for entry
For long: we have the ichimoku crosses between tenkan and baselines, we have a rising kdj line and at the same time we have a increase in the average high
For short: we have the ichimoku crosses between tenkan and baselines, we have a falling kdj line and at the same time we have an increase in the average low
Rules for exit
We exit when we have inverse conditions than the initial ones used for entry.
Caution
This strategy does not use a risk management, so be careful with it !
If you have any questions let me know !

Scalping Trading System ALERT Crypto and StocksThis is the alert version of the strategy with the same name.
Indicators
SImple Moving Average
Exponential Moving Average
Keltner Channels
MACD Histogram
Stochastics
Rules for entry
long= Close of the candle bigger than both moving averages and close of the candle is between the top and bot levels from Keltner . At the same time the macd histogram is negative and stochastic is below 50.
short= Close of the candle smaller than both moving averages and close of the candle is between the top and bot levels from Keltner . At the same time the macd histogram is positive and stochastic is above 50.
Rules for exit
We exit when we meet an opposite reverse order.
This strategy has no risk management inside, so use it with caution !

CDC ActionZone Multi-TF,Mult-Ticker with alert() [P-O-Concept]This is proof-of-concept for using single screen displaying triggering signal of multiple stock/crypto
This source code is subject to the terms of the Mozilla Public License 2.0 at mozilla.org
1. Original CDC Action Zone v3 2020 by © piriya33
Source of original indicator :
2. Table concept/part of code is pulled from Portfolio Tracker
***************************************************************************
CDC Action Zone is based on a simple EMA crossover between EMA12 and EMA26
The zones are defined by the relative position of price in relation to the two EMA lines
Different zones can be use to activate / deactivate other trading strategies
The strategy can also be used on its own with acceptable result, buy on the first green candle
and sell on the first red candle
***************************************************************************
Hint Color Meaning :
Green = FastMA > SlowMA and Price is above FastMA
Blue = FastMA < SlowMA and Price is above both MA
LightBlue = FastMA < SlowMA and Price is between both MA
Red = FastMA < SlowMA and Price is below FastMA
Orange = FastMA > SlowMA and Price is below both MA
Yellow = FastMA > SlowMA and Price is between both MA
Blue/LightBlue/Orange/Yellow should be used with another indicator (such as divergent or so)
Cautions:
- This indicator is not meant to be used as "Signal" or "Trading System"
- This indicator provide a quick-glimpse to multiple ticker in same screen. You'll still have to see indications using original CDC Action Zone (If you're using with CDC System), or combining with another indicator (For shorter tf or scalping, or short/long cover)
- Up to 10 Tickers / Timeframe + Current ticker
Alert Creation Guideline
If this indicator will be used as alert. The timeframe for ticker should be set to "same as" the chart you're using, ie, to set alert on 4h, it should be created in 4h-timeframe (Alert is fired on bar close, using 1D-TABLE in 4H-CHART may trigger alert up to 6 times. else if using in 4H-TABLE in 1D-CHART the alert may not trigger at all)
Considering using ohlc4, hlc3, hl2 for market with no session
PS. Send me a message if you see any bug. (especially if using JSON, I have no chance to test with multiple alert at same tick.)

Scalping EMA ADX RSI with Buy/Sell AlertsThis is a study indicator that shows the entries in the strategy seen in one of the youtube channel so it does not belong to me. I can't tell who it is because it's against the House Rules to advertise but you can find out if you look for it on youtube. Default values of oscilators and ema adjusted as suggested. He says he got the best results in 5 min timeframe but i tried to make things as modifiable as possible so you can mess around with the settings and create your own strategy for different timeframes if you'd like. Suggested to use with normal candlestick charts. The blue line below indicates the ADX is above the selected threshold set in the settings named "Trend Ready Limit". You can set alerts for Buy, Sell or Buy/Sell signal together.
The entry strategy itself is pretty straight forward.
The rules for entry are as follows, the script will check all of this on auto and will give you buy or sell signal :
Recommended time frame: 5 min
For Long Entry:
- Check if price above the set EMA (Can disable this rule if you'd like in the settings)
- RSI is in Oversold
- ADX is above set "Trend Ready" threshold (Meaning there is a trend going on)
- Price must approve the trend of previous candles. This is bullish for buy entries and bearish for sell entries.
- Enter with stop loss below last swing low with 1:1 or 1.5:1 take profit ratio.
For Short Entry:
- Check if price below the set EMA (Can disable this rule if you'd like in the settings)
- RSI is in Overbought
- ADX is above set "Trend Ready" threshold (Meaning there is a trend going on)
- Price must approve the trend of previous candles. This is bullish for buy entries and bearish for sell entries.
- Enter with stop loss above last swing high with 1:1 or 1.5:1 take profit ratio.
This is my first indicator. Let me know if you want any updates. I am not sure if i can add everything but i'll try nonetheless.
Changed: Signals will check up to 2 candles before if the RSI is below or above the set value to show signal. This is because sometimes the entry signal is right but the response might be a bit late.
